Empowering Australians to Make Smarter Financial Decisions
Instantly access powerful financial tools to confidently create a personalised financial plan.
Get Started Building Your Financial Plan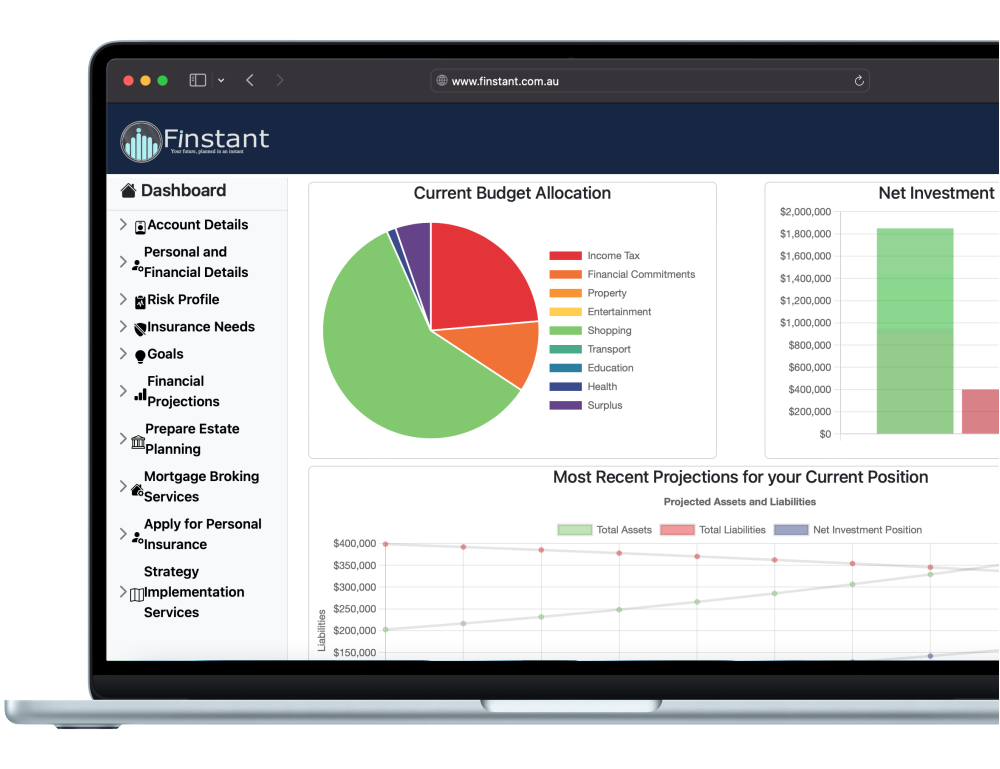
Instantly access powerful financial tools to confidently create a personalised financial plan.
Get Started Building Your Financial PlanMr Indy Cisive and Mrs Dee Cisive
| Scenarios to Compare |
|---|
| Current |
| $2.5m Prop & 1 Baby |
Based on your current position as you have detailed it and your ability to maintain the provided budget it is forecast that you will have a cashflow surplus of $74,013.73 for the 4 months to 30 June 2026. In the first full year you are projected to have a $196,281.73 surplus which will then grow to:
| Projected Cashflow | ||||||||||
|---|---|---|---|---|---|---|---|---|---|---|
| Financial Year Ended | 2026 | 2027 | 2028 | 2029 | 2030 | 2031 | 2032 | 2033 | 2034 | 2035 |
| Total Income | $199,807.68 | $534,268.05 | $554,886.94 | $576,342.16 | $598,877.19 | $622,560.96 | $647,467.38 | $673,675.61 | $701,270.63 | $730,343.56 |
| Total Expenses | $125,793.95 | $337,986.33 | $356,626.89 | $371,264.08 | $386,488.94 | $402,333.21 | $418,830.89 | $436,018.08 | $453,933.46 | $472,618.23 |
| Net Cashflow | $74,013.73 | $196,281.73 | $198,260.05 | $205,078.08 | $212,388.27 | $220,227.75 | $228,636.49 | $237,657.52 | $247,337.17 | $257,725.33 |
| Indy's Income Tax Calculation | ||||||||||
|---|---|---|---|---|---|---|---|---|---|---|
| Full Financial Year Ended | 2026 | 2027 | 2028 | 2029 | 2030 | 2031 | 2032 | 2033 | 2034 | 2035 |
| Assessable Income | ||||||||||
| Employment Income | ||||||||||
| Stressful Role at Employer A | $300,000.00 | $307,500.00 | $315,187.50 | $323,067.19 | $331,143.87 | $339,422.46 | $347,908.03 | $356,605.73 | $365,520.87 | $374,658.89 |
| Total Assessable Income | $300,000.00 | $307,500.00 | $315,187.50 | $323,067.19 | $331,143.87 | $339,422.46 | $347,908.03 | $356,605.73 | $365,520.87 | $374,658.89 |
| Taxable Income | ||||||||||
| Taxable Income | $300,000.00 | $307,500.00 | $315,187.50 | $323,067.19 | $331,143.87 | $339,422.46 | $347,908.03 | $356,605.73 | $365,520.87 | $374,658.89 |
| Tax Payable | ||||||||||
| Income Tax Payable | $122,038.00 | $126,270.00 | $133,584.38 | $138,390.98 | $143,317.76 | $148,367.70 | $153,543.90 | $158,849.49 | $164,287.73 | $169,861.92 |
| Medicare Levy | $6,000.00 | $6,150.00 | $6,303.75 | $6,461.34 | $6,622.88 | $6,788.45 | $6,958.16 | $7,132.11 | $7,310.42 | $7,493.18 |
| Total Tax Payable | $128,038.00 | $132,420.00 | $139,888.12 | $144,852.33 | $149,940.64 | $155,156.15 | $160,502.06 | $165,981.61 | $171,598.15 | $177,355.10 |
| Cumulative Total Tax Payable | $49,245.38 | $181,665.38 | $321,553.51 | $466,405.84 | $616,346.47 | $771,502.63 | $932,004.68 | $1,097,986.29 | $1,269,584.44 | $1,446,939.54 |
| Dee's Income Tax Calculation | ||||||||||
|---|---|---|---|---|---|---|---|---|---|---|
| Full Financial Year Ended | 2026 | 2027 | 2028 | 2029 | 2030 | 2031 | 2032 | 2033 | 2034 | 2035 |
| Assessable Income | ||||||||||
| Employment Income | ||||||||||
| Manager at Employer B | $160,000.00 | $164,000.00 | $168,100.00 | $172,302.50 | $176,610.06 | $181,025.31 | $185,550.95 | $190,189.72 | $194,944.46 | $199,818.08 |
| Investment Income | ||||||||||
| Australia Bank HISA | $55,200.00 | $55,200.00 | $55,200.00 | $55,200.00 | $55,200.00 | $55,200.00 | $55,200.00 | $55,200.00 | $55,200.00 | $55,200.00 |
| VAS - Vanguard Australian Shares Index Etf | $4,299.96 | $7,568.05 | $16,399.44 | $25,772.47 | $35,923.26 | $46,913.19 | $58,808.40 | $71,680.16 | $85,605.30 | $100,666.59 |
| Total Assessable Income | $222,079.94 | $231,308.89 | $249,539.10 | $268,738.45 | $289,287.29 | $311,286.42 | $334,844.38 | $360,077.98 | $387,112.94 | $416,084.62 |
| Taxable Income | ||||||||||
| Taxable Income | $222,079.94 | $231,308.89 | $249,539.10 | $268,738.45 | $289,287.29 | $311,286.42 | $334,844.38 | $360,077.98 | $387,112.94 | $416,084.62 |
| Tax Payable | ||||||||||
| Income Tax Payable | $75,285.96 | $80,555.33 | $93,538.85 | $105,250.46 | $117,785.24 | $131,204.72 | $145,575.07 | $160,967.57 | $177,458.89 | $195,131.62 |
| Medicare Levy | $4,441.60 | $4,626.18 | $4,990.78 | $5,374.77 | $5,785.75 | $6,225.73 | $6,696.89 | $7,201.56 | $7,742.26 | $8,321.69 |
| Imputation/Franking Credits | $2,579.98 | $4,540.83 | $9,839.66 | $15,463.48 | $21,553.96 | $28,147.92 | $35,285.04 | $43,008.10 | $51,363.18 | $60,399.95 |
| Total Tax Payable | $77,147.58 | $80,640.68 | $88,689.97 | $95,161.74 | $102,017.03 | $109,282.53 | $116,986.92 | $125,161.03 | $133,837.97 | $143,053.36 |
| Cumulative Total Tax Payable | $29,672.15 | $110,312.83 | $199,002.80 | $294,164.54 | $396,181.57 | $505,464.10 | $622,451.02 | $747,612.05 | $881,450.03 | $1,024,503.38 |
Based on your current position as you have detailed it at the end of the first financial year you are projected to have total assets of $1,934,271.03. This is the projected to:
| Projected Assets | ||||||||||
|---|---|---|---|---|---|---|---|---|---|---|
| Financial Year Ended | 2026 | 2027 | 2028 | 2029 | 2030 | 2031 | 2032 | 2033 | 2034 | 2035 |
| Investment Assets | ||||||||||
| VAS - Vanguard Australian Shares Index Etf | $176,001.26 | $381,382.26 | $599,359.77 | $835,424.75 | $1,091,004.48 | $1,367,637.16 | $1,666,980.49 | $1,990,820.90 | $2,341,083.52 | $2,719,842.86 |
| High-growth Investment Portfolio | $0.00 | $0.00 | $0.00 | $0.00 | $0.00 | $0.00 | $0.00 | $0.00 | $0.00 | $0.00 |
| Australia Bank HISA | $1,200,000.00 | $1,200,000.00 | $1,200,000.00 | $1,200,000.00 | $1,200,000.00 | $1,200,000.00 | $1,200,000.00 | $1,200,000.00 | $1,200,000.00 | $1,200,000.00 |
| Indy's Superannuation | ||||||||||
| Superannuation Fund (Accumulation) | $279,932.60 | $328,483.32 | $381,605.80 | $439,685.71 | $503,140.29 | $572,420.90 | $648,015.82 | $730,453.22 | $820,304.39 | $918,187.26 |
| Dee's Superannuation | ||||||||||
| Superannuation Fund (Accumulation) | $278,337.17 | $319,625.92 | $364,976.23 | $414,756.96 | $469,369.75 | $529,251.99 | $594,879.91 | $666,772.06 | $745,493.03 | $831,657.53 |
| Non-Financial Assets | ||||||||||
| Total Assets | $1,934,271.03 | $2,229,491.50 | $2,545,941.80 | $2,889,867.42 | $3,263,514.52 | $3,669,310.05 | $4,109,876.22 | $4,588,046.18 | $5,106,880.94 | $5,669,687.65 |
Based on your current position as you have detailed it at the end of the first financial year Indy is projected to have a total superannuation balance of $279,932.60. This is the projected to:
At the end of the first financial year Dee is projected to have a total superannuation balance of $278,337.17. This is the projected to:
| Indy's Superannuation | ||||||||||
|---|---|---|---|---|---|---|---|---|---|---|
| Financial Year Ended | 2026 | 2027 | 2028 | 2029 | 2030 | 2031 | 2032 | 2033 | 2034 | 2035 |
| Concessional Contribution Cap | $30,000.00 | $30,000.00 | $30,000.00 | $32,500.00 | $32,500.00 | $32,500.00 | $35,000.00 | $35,000.00 | $35,000.00 | $37,500.00 |
| Concessional Cap incl. Carry Forward Balance | $30,000.00 | $30,000.00 | $30,000.00 | $32,500.00 | $32,693.28 | $32,500.00 | $35,000.00 | $35,000.00 | $35,000.00 | $37,500.00 |
| Employer Contributions | $30,000.00 | $30,750.00 | $31,518.75 | $32,306.72 | $33,114.39 | $33,942.25 | $34,790.80 | $35,660.57 | $36,552.09 | $37,465.89 |
| Personal Concessional Contributions incl. Salary Sacrifice | $0.00 | $0.00 | $0.00 | $0.00 | $0.00 | $0.00 | $0.00 | $0.00 | $0.00 | $0.00 |
| Unused Concessional Cap | $0.00 | $0.00 | $0.00 | $193.28 | $0.00 | $0.00 | $209.20 | $0.00 | $0.00 | $34.11 |
| Non-concessional Contribution Cap | $120,000.00 | $120,000.00 | $120,000.00 | $130,000.00 | $130,000.00 | $130,000.00 | $140,000.00 | $140,000.00 | $140,000.00 | $150,000.00 |
| Bring Forward Balance Available | $360,000.00 | $360,000.00 | $360,000.00 | $360,000.00 | $390,000.00 | $390,000.00 | $390,000.00 | $420,000.00 | $420,000.00 | $420,000.00 |
| Personal Non-concessional Contributions | $0.00 | $0.00 | $0.00 | $0.00 | $0.00 | $0.00 | $0.00 | $0.00 | $0.00 | $0.00 |
| Unused Non-concessional Cap | $120,000.00 | $120,000.00 | $120,000.00 | $130,000.00 | $130,000.00 | $130,000.00 | $140,000.00 | $140,000.00 | $140,000.00 | $150,000.00 |
| Total Superannuation Balance | $279,932.60 | $328,483.32 | $381,605.80 | $439,685.71 | $503,140.29 | $572,420.90 | $648,015.82 | $730,453.22 | $820,304.39 | $918,187.26 |
| Total Superannuation Balance (Inflation Adjusted) | $279,932.60 | $320,471.53 | $363,217.90 | $408,291.89 | $455,820.27 | $505,936.67 | $558,782.01 | $614,504.90 | $673,262.01 | $735,218.58 |
| Dee's Superannuation | ||||||||||
|---|---|---|---|---|---|---|---|---|---|---|
| Financial Year Ended | 2026 | 2027 | 2028 | 2029 | 2030 | 2031 | 2032 | 2033 | 2034 | 2035 |
| Concessional Contribution Cap | $30,000.00 | $30,000.00 | $30,000.00 | $32,500.00 | $32,500.00 | $32,500.00 | $35,000.00 | $35,000.00 | $35,000.00 | $37,500.00 |
| Concessional Cap incl. Carry Forward Balance | $30,000.00 | $40,800.00 | $51,120.00 | $63,448.00 | $75,271.70 | $86,578.49 | $35,000.00 | $35,000.00 | $35,000.00 | $37,500.00 |
| Employer Contributions | $19,200.00 | $19,680.00 | $20,172.00 | $20,676.30 | $21,193.21 | $21,723.04 | $22,266.11 | $22,822.77 | $23,393.34 | $23,978.17 |
| Personal Concessional Contributions incl. | $0.00 | $0.00 | $0.00 | $0.00 | $0.00 | $0.00 | $0.00 | $0.00 | $0.00 | $0.00 |
| Unused Concessional Cap | $10,800.00 | $10,320.00 | $9,828.00 | $11,823.70 | $11,306.79 | $10,776.96 | $12,733.89 | $12,177.23 | $11,606.66 | $13,521.83 |
| Non-concessional Contribution Cap | $120,000.00 | $120,000.00 | $120,000.00 | $130,000.00 | $130,000.00 | $130,000.00 | $140,000.00 | $140,000.00 | $140,000.00 | $150,000.00 |
| Bring Forward Balance Available | $360,000.00 | $360,000.00 | $360,000.00 | $360,000.00 | $390,000.00 | $390,000.00 | $390,000.00 | $420,000.00 | $420,000.00 | $420,000.00 |
| Personal Non-concessional Contributions | $0.00 | $0.00 | $0.00 | $0.00 | $0.00 | $0.00 | $0.00 | $0.00 | $0.00 | $0.00 |
| Unused Non-concessional Cap | $120,000.00 | $120,000.00 | $120,000.00 | $130,000.00 | $130,000.00 | $130,000.00 | $140,000.00 | $140,000.00 | $140,000.00 | $150,000.00 |
| Total Superannuation Balance | $278,337.17 | $319,625.92 | $364,976.23 | $414,756.96 | $469,369.75 | $529,251.99 | $594,879.91 | $666,772.06 | $745,493.03 | $831,657.53 |
| Total Superannuation Balance (Inflation Adjusted) | $278,337.17 | $311,830.17 | $347,389.63 | $385,143.07 | $425,225.83 | $467,781.64 | $512,963.08 | $560,932.16 | $611,860.85 | $665,931.77 |
Based on your current repayment schedule and any allocation of surplus cashflow towards your debt it is projected that you will be able to repay your debts as follows:
In this scenario it is forecast that you will have a cashflow surplus of $74,013.73 for the 4 months to 30 June 2026. In the first full year you are projected to have a $94,270.42 surplus which will then grow to:
| Projected Cashflow | ||||||||||
|---|---|---|---|---|---|---|---|---|---|---|
| Financial Year Ended | 2026 | 2027 | 2028 | 2029 | 2030 | 2031 | 2032 | 2033 | 2034 | 2035 |
| Total Income | $199,807.68 | $3,098,264.44 | $410,559.63 | $508,474.13 | $523,899.61 | $539,889.29 | $557,434.22 | $575,857.73 | $595,061.74 | $615,103.34 |
| Total Expenses | $125,793.95 | $3,003,994.01 | $399,619.71 | $453,503.27 | $466,664.72 | $457,828.79 | $467,957.09 | $482,099.36 | $496,426.27 | $511,257.22 |
| Net Cashflow | $74,013.73 | $94,270.42 | $10,939.92 | $54,970.87 | $57,234.92 | $82,060.50 | $89,477.15 | $93,758.37 | $98,635.46 | $103,846.10 |
| Indy's Income Tax Calculation | ||||||||||
|---|---|---|---|---|---|---|---|---|---|---|
| Full Financial Year Ended | 2026 | 2027 | 2028 | 2029 | 2030 | 2031 | 2032 | 2033 | 2034 | 2035 |
| Assessable Income | ||||||||||
| Employment Income | ||||||||||
| Stressful Role at Employer A | $300,000.00 | $307,500.00 | $315,187.50 | $323,067.19 | $331,143.87 | $339,422.46 | $347,908.03 | $356,605.73 | $365,520.87 | $374,658.89 |
| Paid Parental Leave Baby 1 | ||||||||||
| Total Assessable Income | $300,000.00 | $307,500.00 | $315,187.50 | $323,067.19 | $331,143.87 | $339,422.46 | $347,908.03 | $356,605.73 | $365,520.87 | $374,658.89 |
| Taxable Income | ||||||||||
| Taxable Income | $300,000.00 | $307,500.00 | $315,187.50 | $323,067.19 | $331,143.87 | $339,422.46 | $347,908.03 | $356,605.73 | $365,520.87 | $374,658.89 |
| Tax Payable | ||||||||||
| Income Tax Payable | $122,038.00 | $126,270.00 | $133,584.38 | $138,390.98 | $143,317.76 | $148,367.70 | $153,543.90 | $158,849.49 | $164,287.73 | $169,861.92 |
| Medicare Levy | $6,000.00 | $6,150.00 | $6,303.75 | $6,461.34 | $6,622.88 | $6,788.45 | $6,958.16 | $7,132.11 | $7,310.42 | $7,493.18 |
| Total Tax Payable | $128,038.00 | $136,920.00 | $139,888.12 | $144,852.33 | $149,940.64 | $155,156.15 | $160,502.06 | $165,981.61 | $171,598.15 | $177,355.10 |
| Cumulative Total Tax Payable | $49,245.38 | $186,165.38 | $326,053.51 | $470,905.84 | $620,846.47 | $776,002.63 | $936,504.68 | $1,102,486.29 | $1,274,084.44 | $1,451,439.54 |
| Dee's Income Tax Calculation | ||||||||||
|---|---|---|---|---|---|---|---|---|---|---|
| Full Financial Year Ended | 2026 | 2027 | 2028 | 2029 | 2030 | 2031 | 2032 | 2033 | 2034 | 2035 |
| Assessable Income | ||||||||||
| Employment Income | ||||||||||
| Manager at Employer B | $160,000.00 | $82,901.10 | $83,359.18 | $172,302.50 | $176,610.06 | $181,025.31 | $185,550.95 | $190,189.72 | $194,944.46 | $199,818.08 |
| Paid Parental Leave Baby 1 | $0.00 | $23,209.49 | $0.00 | $0.00 | $0.00 | $0.00 | $0.00 | $0.00 | $0.00 | $0.00 |
| Investment Income | ||||||||||
| Australia Bank HISA | $55,200.00 | $55,200.00 | $0.00 | $0.00 | $0.00 | $0.00 | $0.00 | $0.00 | $0.00 | $0.00 |
| VAS - Vanguard Australian Shares Index Etf | $4,299.96 | $7,568.05 | $12,012.95 | $13,104.44 | $16,145.68 | $19,441.52 | $23,975.24 | $29,062.28 | $34,596.41 | $40,626.37 |
| Total Assessable Income | $222,079.94 | $173,419.47 | $102,579.90 | $193,269.60 | $202,443.16 | $212,131.74 | $223,911.34 | $236,689.37 | $250,298.72 | $264,820.27 |
| Taxable Income | ||||||||||
| Taxable Income | $222,079.94 | $173,419.47 | $102,579.90 | $193,269.60 | $202,443.16 | $212,131.74 | $223,911.34 | $236,689.37 | $250,298.72 | $264,820.27 |
| Tax Payable | ||||||||||
| Income Tax Payable | $75,285.96 | $48,308.76 | $21,869.77 | $59,214.46 | $64,810.33 | $70,720.36 | $77,905.92 | $85,700.52 | $94,002.22 | $102,860.36 |
| Medicare Levy | $4,441.60 | $3,468.39 | $2,051.60 | $3,865.39 | $4,048.86 | $4,242.63 | $4,478.23 | $4,733.79 | $5,005.97 | $5,296.41 |
| Imputation/Franking Credits | $2,579.98 | $4,540.83 | $7,207.77 | $7,862.66 | $9,687.41 | $11,664.91 | $14,385.15 | $17,437.37 | $20,757.85 | $24,375.82 |
| Total Tax Payable | $77,147.58 | $47,236.32 | $16,713.60 | $55,217.19 | $59,171.78 | $63,298.09 | $67,999.00 | $72,996.94 | $78,250.35 | $83,780.95 |
| Cumulative Total Tax Payable | $29,672.15 | $76,908.47 | $93,622.06 | $148,839.25 | $208,011.03 | $271,309.11 | $339,308.11 | $412,305.05 | $490,555.39 | $574,336.34 |
In this scenario at the end of the first financial year you are projected to have total assets of $1,934,271.03. This is the projected to:
| Projected Assets | ||||||||||
|---|---|---|---|---|---|---|---|---|---|---|
| Financial Year Ended | 2026 | 2027 | 2028 | 2029 | 2030 | 2031 | 2032 | 2033 | 2034 | 2035 |
| Property | ||||||||||
| New PPR | $0.00 | $2,635,439.56 | $2,826,508.93 | $3,031,430.83 | $3,251,209.56 | $3,486,922.25 | $3,739,724.12 | $4,010,854.12 | $4,301,641.04 | $4,613,510.01 |
| Investment Assets | ||||||||||
| VAS - Vanguard Australian Shares Index Etf | $176,001.26 | $279,370.95 | $304,754.35 | $375,481.02 | $452,128.30 | $557,563.83 | $675,867.04 | $804,567.73 | $944,799.35 | $1,097,491.58 |
| High-growth Investment Portfolio | $0.00 | $0.00 | $0.00 | $0.00 | $0.00 | $0.00 | $0.00 | $0.00 | $0.00 | $0.00 |
| Australia Bank HISA | $1,200,000.00 | $100,000.00 | $100,000.00 | $100,000.00 | $100,000.00 | $100,000.00 | $100,000.00 | $100,000.00 | $100,000.00 | $100,000.00 |
| Indy's Superannuation | ||||||||||
| Superannuation Fund (Accumulation) | $279,932.60 | $328,483.32 | $381,605.80 | $439,685.71 | $503,140.29 | $572,420.90 | $648,015.82 | $730,453.22 | $820,304.39 | $918,187.26 |
| Dee's Superannuation | ||||||||||
| Superannuation Fund (Accumulation) | $278,337.17 | $307,172.34 | $338,493.91 | $385,937.81 | $438,007.57 | $495,122.38 | $557,738.67 | $626,353.44 | $701,507.83 | $783,791.02 |
| Non-Financial Assets | ||||||||||
| Total Assets | $1,934,271.03 | $3,650,466.17 | $3,951,362.99 | $4,332,535.37 | $4,744,485.72 | $5,212,029.36 | $5,721,345.65 | $6,272,228.51 | $6,868,252.61 | $7,512,979.87 |
In this scenario at the end of the first financial year Indy is projected to have a total superannuation balance of $279,932.60. This is the projected to:
At the end of the first financial year Dee is projected to have a total superannuation balance of $278,337.17. This is the projected to:
| Indy's Superannuation | ||||||||||
|---|---|---|---|---|---|---|---|---|---|---|
| Financial Year Ended | 2026 | 2027 | 2028 | 2029 | 2030 | 2031 | 2032 | 2033 | 2034 | 2035 |
| Concessional Contribution Cap | $30,000.00 | $30,000.00 | $30,000.00 | $32,500.00 | $32,500.00 | $32,500.00 | $35,000.00 | $35,000.00 | $35,000.00 | $37,500.00 |
| Concessional Cap incl. Carry Forward Balance | $30,000.00 | $30,000.00 | $30,000.00 | $32,500.00 | $32,693.28 | $32,500.00 | $35,000.00 | $35,000.00 | $35,000.00 | $37,500.00 |
| Employer Contributions | $30,000.00 | $30,750.00 | $31,518.75 | $32,306.72 | $33,114.39 | $33,942.25 | $34,790.80 | $35,660.57 | $36,552.09 | $37,465.89 |
| Personal Concessional Contributions incl. Salary Sacrifice | $0.00 | $0.00 | $0.00 | $0.00 | $0.00 | $0.00 | $0.00 | $0.00 | $0.00 | $0.00 |
| Unused Concessional Cap | $0.00 | $0.00 | $0.00 | $193.28 | $0.00 | $0.00 | $209.20 | $0.00 | $0.00 | $34.11 |
| Non-concessional Contribution Cap | $120,000.00 | $120,000.00 | $120,000.00 | $130,000.00 | $130,000.00 | $130,000.00 | $140,000.00 | $140,000.00 | $140,000.00 | $150,000.00 |
| Bring Forward Balance Available | $360,000.00 | $360,000.00 | $360,000.00 | $360,000.00 | $390,000.00 | $390,000.00 | $390,000.00 | $420,000.00 | $420,000.00 | $420,000.00 |
| Personal Non-concessional Contributions | $0.00 | $0.00 | $0.00 | $0.00 | $0.00 | $0.00 | $0.00 | $0.00 | $0.00 | $0.00 |
| Unused Non-concessional Cap | $120,000.00 | $120,000.00 | $120,000.00 | $130,000.00 | $130,000.00 | $130,000.00 | $140,000.00 | $140,000.00 | $140,000.00 | $150,000.00 |
| Total Superannuation Balance | $279,932.60 | $328,483.32 | $381,605.80 | $439,685.71 | $503,140.29 | $572,420.90 | $648,015.82 | $730,453.22 | $820,304.39 | $918,187.26 |
| Total Superannuation Balance (Inflation Adjusted) | $279,932.60 | $320,471.53 | $363,217.90 | $408,291.89 | $455,820.27 | $505,936.67 | $558,782.01 | $614,504.90 | $673,262.01 | $735,218.58 |
| Dee's Superannuation | ||||||||||
|---|---|---|---|---|---|---|---|---|---|---|
| Financial Year Ended | 2026 | 2027 | 2028 | 2029 | 2030 | 2031 | 2032 | 2033 | 2034 | 2035 |
| Concessional Contribution Cap | $30,000.00 | $30,000.00 | $30,000.00 | $32,500.00 | $32,500.00 | $32,500.00 | $35,000.00 | $35,000.00 | $35,000.00 | $37,500.00 |
| Concessional Cap incl. Carry Forward Balance | $30,000.00 | $40,800.00 | $60,851.87 | $83,348.77 | $95,172.47 | $106,479.26 | $108,956.22 | $35,000.00 | $35,000.00 | $37,500.00 |
| Employer Contributions | $19,200.00 | $9,948.13 | $10,003.10 | $20,676.30 | $21,193.21 | $21,723.04 | $22,266.11 | $22,822.77 | $23,393.34 | $23,978.17 |
| Personal Concessional Contributions incl. | $0.00 | $0.00 | $0.00 | $0.00 | $0.00 | $0.00 | $0.00 | $0.00 | $0.00 | $0.00 |
| Unused Concessional Cap | $10,800.00 | $20,051.87 | $19,996.90 | $11,823.70 | $11,306.79 | $10,776.96 | $12,733.89 | $12,177.23 | $11,606.66 | $13,521.83 |
| Non-concessional Contribution Cap | $120,000.00 | $120,000.00 | $120,000.00 | $130,000.00 | $130,000.00 | $130,000.00 | $140,000.00 | $140,000.00 | $140,000.00 | $150,000.00 |
| Bring Forward Balance Available | $360,000.00 | $360,000.00 | $360,000.00 | $360,000.00 | $390,000.00 | $390,000.00 | $390,000.00 | $420,000.00 | $420,000.00 | $420,000.00 |
| Personal Non-concessional Contributions | $0.00 | $0.00 | $0.00 | $0.00 | $0.00 | $0.00 | $0.00 | $0.00 | $0.00 | $0.00 |
| Unused Non-concessional Cap | $120,000.00 | $120,000.00 | $120,000.00 | $130,000.00 | $130,000.00 | $130,000.00 | $140,000.00 | $140,000.00 | $140,000.00 | $150,000.00 |
| Total Superannuation Balance | $278,337.17 | $307,172.34 | $338,493.91 | $385,937.81 | $438,007.57 | $495,122.38 | $557,738.67 | $626,353.44 | $701,507.83 | $783,791.02 |
| Total Superannuation Balance (Inflation Adjusted) | $278,337.17 | $299,680.33 | $322,183.38 | $358,381.62 | $396,813.24 | $437,616.04 | $480,936.31 | $526,929.37 | $575,760.14 | $627,603.70 |
Based on your current repayment schedule and any allocation of surplus cashflow towards your debt it is projected that you will be able to repay your debts as follows:
Mortgage - New PPR: Australia Bank Mortgage
| Property Type | Ownership Structure | Indy's Ownership Share | Dee's Ownership Share |
|---|---|---|---|
| Principal place of residence | Joint tenancy - (undivided interests) | 50.00% | 50.00% |
| Property Purchase Costs | Amount |
|---|---|
| Purchase Price Ex. Costs | $2,500,000.00 |
| Stamp Duty | $120,555.00 |
| Title Transfer Fee | $165.40 |
| Mortgage Registration Fee | $165.40 |
| Conveyancing Fees | $1,000.00 |
| Lenders Mortgage Insurance | $0.00 |
| Other Costs | $0.00 |
| Purchase Price Incl Costs | $2,621,885.80 |
| First Home Super Saver Release | Amount |
|---|---|
| Indy's Projected Tax Payable on Release: | $0.00 |
| Indy's Projected Net Release: | $0.00 |
| Dee's Projected Tax Payable on Release: | $0.00 |
| Dee's Projected Net Release: | $0.00 |
| Mortgage Details | |
|---|---|
| Mortgage | Australia Bank Mortgage |
| Loan Amount Drawndown | $1,521,885.80 |
| Estimated Borrowing Capacity | $0.00 |
| Loan Term | 360 months |
| Expected Interest Rate | 5.60% |
| Repayments | $8,736.83 Monthly |
| New PPR Budgeted Expenses | Annualised Expenses |
|---|---|
| Council Rates: | $2,500.00 |
| Body Corporate Fees: | $0 |
| Maintenance: | $4,000.00 |
| Electricity: | $3,600.00 |
| Gas: | $1,200.00 |
| Water Rates: | $1,200.00 |
| House and Contents Insurance: | $2,500.00 |
| Emergency Services Levy: | $300.00 |
| Other Expenses | $0 |
| Total Property Expenses | $15,300.00 |
This scenario includes 1 child, your planned future child Baby 1 (born on 1 Jan 2027). Baby 1 will be financially dependent on you until age 18, and for the purposes of any government benefits Baby 1 will be cared for 100.00% of the time.
Following the birth of Baby 1
Based on the time taken off as well as your incomes, Dee is projected to be entitled to 120 days of Government Paid Parental Leave which is $23,209.49.
| Government Paid Parental Leave | |||||||||
|---|---|---|---|---|---|---|---|---|---|
| Financial Year | 2027 | 2028 | 2029 | 2030 | 2031 | 2032 | 2033 | 2034 | 2035 |
| Family Adjusted Income Threshold | $382,421 | $391,982 | $401,781 | $411,826 | $422,122 | $432,675 | $443,492 | $454,579 | $465,943 |
| Individual Adjusted Income Threshold | $184,507 | $189,120 | $193,848 | $198,694 | $203,661 | $208,753 | $213,972 | $219,321 | $224,804 |
| Payment Rate (Per Day) | $194.75 | $199.62 | $204.61 | $209.72 | $214.97 | $220.34 | $225.85 | $231.50 | $237.28 |
| Indy's Projected Payments - Baby 1 ( 0 Days) | $0.00 | $0.00 | $0.00 | $0.00 | $0.00 | $0.00 | $0.00 | $0.00 | $0.00 |
| Dee's Projected Payments - Baby 1 ( 120 Days) | $23,209.49 | $0.00 | $0.00 | $0.00 | $0.00 | $0.00 | $0.00 | $0.00 | $0.00 |
| Total | $0.00 | $0.00 | $0.00 | $0.00 | $0.00 | $0.00 | $0.00 | $0.00 | $0.00 |
Your entitlement to the Family Tax Benefit is calculated based on an adjusted Family Income Estimate as well as the age and number of dependants. Your projected payment entitlements are as follows:
| Projected Family Tax Benefit - 10 Years | ||||||||||
|---|---|---|---|---|---|---|---|---|---|---|
| Financial Year | 2026 | 2027 | 2028 | 2029 | 2030 | 2031 | 2032 | 2033 | 2034 | 2035 |
| Part A | ||||||||||
| Maximum Rate Income Threshold | $65,189.00 | $66,818.73 | $68,489.19 | $70,201.42 | $71,956.46 | $73,755.37 | $75,599.25 | $77,489.24 | $79,426.47 | $81,412.13 |
| Base Rate Income Threshold | $115,997.00 | $118,896.93 | $121,869.35 | $124,916.08 | $128,038.98 | $131,239.96 | $134,520.96 | $137,883.98 | $141,331.08 | $144,864.36 |
| Family Income Estimate | $522,079.94 | $480,919.47 | $417,767.40 | $516,336.79 | $533,587.02 | $551,554.21 | $571,819.36 | $593,295.10 | $615,819.59 | $639,479.16 |
| Projected Payment | $0.00 | $0.00 | $0.00 | $0.00 | $0.00 | $0.00 | $0.00 | $0.00 | $0.00 | $0.00 |
| Part A - Supplement | ||||||||||
| Income Threshold | $80,000.00 | $80,000.00 | $80,000.00 | $80,000.00 | $80,000.00 | $80,000.00 | $80,000.00 | $80,000.00 | $80,000.00 | $80,000.00 |
| Projected Payment | $0.00 | $0.00 | $0.00 | $0.00 | $0.00 | $0.00 | $0.00 | $0.00 | $0.00 | $0.00 |
| Part B | ||||||||||
| Primary Income Threshold | $117,194.00 | $120,123.85 | $123,126.95 | $126,205.12 | $129,360.25 | $132,594.25 | $135,909.11 | $139,306.84 | $142,789.51 | $146,359.25 |
| Secondary Income Threshold | $6,789.00 | $6,958.73 | $7,132.69 | $7,311.01 | $7,493.79 | $7,681.13 | $7,873.16 | $8,069.99 | $8,271.74 | $8,478.53 |
| Projected Payment | $0.00 | $0.00 | $0.00 | $0.00 | $0.00 | $0.00 | $0.00 | $0.00 | $0.00 | $0.00 |
| Projected Payment - Supplement | $0.00 | $0.00 | $0.00 | $0.00 | $0.00 | $0.00 | $0.00 | $0.00 | $0.00 | $0.00 |
| Total | $0.00 | $0.00 | $0.00 | $0.00 | $0.00 | $0.00 | $0.00 | $0.00 | $0.00 | $0.00 |
Eligibility for the Child Care Subsidy (CCS) is determined by an income test and an activity test.
The final subsidy is calculated by applying the subsidy rate to the lower of the actual hourly fee or a government-set hourly rate cap, multiplied by the number of eligible care hours based on the activity test.
| School & University Expenses | ||||||||||
|---|---|---|---|---|---|---|---|---|---|---|
| Financial Year | 2026 | 2027 | 2028 | 2029 | 2030 | 2031 | 2032 | 2033 | 2034 | 2035 |
| Baby 1 | $0.00 | $18,769.36 | $33,703.30 | $42,337.99 | $44,670.62 | $23,791.90 | $20,817.30 | $21,337.56 | $21,871.00 | $22,417.77 |
Strategy Overview
This Scenario looks to increase your regular debt repayments throughout the year with any surplus income. This occurs as follows:
By making additional debt repayments you can both reduce the time it takes to repay the loan and the total interest cost over the life of the loan. A loans repayments are calculated such that it will be repaid exactly in the loan term, any additional repayments directly repay the principal and this compounds to reduce the cumulative interest you will be required to pay over the life of the loan.
Mortgage - New PPR: Australia Bank Mortgage
| Financial Year Ended | 2026 | 2027 | 2028 | 2029 | 2030 | 2031 | 2032 | 2033 | 2034 | 2035 |
|---|---|---|---|---|---|---|---|---|---|---|
| Repayment Increase - Monthly | $0.00 | $0.00 | $911.66 | $4,557.70 | $4,663.22 | $6,603.70 | $6,998.68 | $7,141.98 | $7,314.80 | $7,493.01 |
| New Repayment - Monthly | $0.00 | $0.00 | $9,647.00 | $13,293.00 | $13,399.00 | $15,339.00 | $15,734.00 | $15,877.00 | $16,050.00 | $16,229.00 |
By increasing your repayments to the amount projected it is projected that:
Projected Benefit of Strategy
Projected Net Investment Position
Strategy Overview
This strategy invests in line with the investment portfolio detailed in your VAS Investment Goal. Any available cashflow surplus will be invested utilising debt recycling to repay debt faster while simultaneously investing to grow your wealth.
Gearing Considerations
Gearing, or borrowing to invest, is typically suitable for investors with a high risk tolerance, a long-term investment horizon, and the ability to manage borrowing costs. While gearing increases the amount available for investment and can amplify returns when investment gains exceed borrowing costs, it also magnifies losses if the investment underperforms.
Debt Recycling has several benefits compared to gearing with through a margin lending facility. As the loan is a mortgage secured by a property rather than a margin loan secured by the underlying investments there is no risk of a margin call. A mortgage will also more often than not have a lower interest rate than a margin loan.
Ownership Considerations
You should also evaluate whether a different ownership structure might provide a more optimal outcome. Ownership arrangements can significantly impact the tax treatment of investment earnings, estate planning, and asset protection. Other structures, such as trusts or holding companies, may provide advantages in estate planning and asset protection as well as offer additional tax planning opportunities. These options can facilitate income splitting and/or reducing tax on earnings. However, they often come with greater complexity and setup costs, so it’s important to weigh the potential benefits against these factors to ensure the structure provides meaningful advantages. Additionally, if the investments are geared, these structures may be less suitable, as the deductions for interest expenses are typically limited to the income within the trust or company, preventing you from offsetting the costs against your personal income.
VAS - Vanguard Australian Shares Index Etf
| Financial Year Ended | 2026 | 2027 | 2028 | 2029 | 2030 | 2031 | 2032 | 2033 | 2034 | 2035 |
|---|---|---|---|---|---|---|---|---|---|---|
| Opening Balance | $99,999.09 | $176,001.26 | $279,370.95 | $333,839.08 | $438,444.45 | $554,318.82 | $706,379.25 | $879,477.02 | $1,072,162.74 | $1,286,675.35 |
| Investment Income | $1,653.83 | $7,568.05 | $12,012.95 | $14,355.08 | $18,853.11 | $23,835.71 | $30,374.31 | $37,817.51 | $46,103.00 | $55,327.04 |
| Capital Growth | $1,988.44 | $9,099.27 | $14,443.48 | $17,259.48 | $22,667.58 | $28,658.28 | $36,519.81 | $45,468.96 | $55,430.81 | $66,521.12 |
| Debt Recycling Contributions | $0.00 | $0.00 | $40,024.66 | $87,345.88 | $93,206.79 | $123,402.15 | $136,577.97 | $147,216.76 | $159,081.80 | $171,976.22 |
| Contributions | $74,013.73 | $94,270.42 | $0.00 | $0.00 | $0.00 | $0.00 | $0.00 | $0.00 | $0.00 | $0.00 |
| Closing Balance | $176,001.26 | $279,370.95 | $333,839.08 | $438,444.45 | $554,318.82 | $706,379.25 | $879,477.02 | $1,072,162.74 | $1,286,675.35 | $1,525,172.69 |
| Closing Balance (Inflation Adjusted) | $176,001.26 | $272,557.02 | $317,752.85 | $407,139.26 | $502,185.49 | $624,336.33 | $758,370.28 | $901,973.24 | $1,056,034.38 | $1,221,249.03 |
Mortgage - New PPR: Australia Bank Mortgage Debt Recycling Balance
| Financial Year Ended | 2026 | 2027 | 2028 | 2029 | 2030 | 2031 | 2032 | 2033 | 2034 | 2035 |
|---|---|---|---|---|---|---|---|---|---|---|
| Opening Balance | $0.00 | $0.00 | $0.00 | $40,024.66 | $127,370.54 | $220,577.34 | $343,979.48 | $480,557.45 | $627,774.20 | $786,856.00 |
| Repayments | $0.00 | $0.00 | $0.00 | $2,185.83 | $6,955.97 | $12,046.19 | $18,785.43 | $26,244.24 | $34,284.05 | $42,971.84 |
| Interest Expense | $0.00 | $0.00 | $0.00 | $2,185.83 | $6,955.97 | $12,046.19 | $18,785.43 | $26,244.24 | $34,284.05 | $42,971.84 |
| Drawdown | $0.00 | $0.00 | $40,024.66 | $87,345.88 | $93,206.79 | $123,402.15 | $136,577.97 | $147,216.76 | $159,081.80 | $171,976.22 |
| Closing Balance | $0.00 | $0.00 | $40,024.66 | $127,370.54 | $220,577.34 | $343,979.48 | $480,557.45 | $627,774.20 | $786,856.00 | $958,832.22 |
Mortgage - New PPR: Australia Bank Mortgage
| Financial Year Ended | 2026 | 2027 | 2028 | 2029 | 2030 | 2031 | 2032 | 2033 | 2034 | 2035 |
|---|---|---|---|---|---|---|---|---|---|---|
| Repayment Increase - Monthly | $0.00 | $0.00 | $911.66 | $4,575.21 | $4,654.00 | $6,683.73 | $7,192.90 | $7,435.92 | $7,730.19 | $8,054.11 |
| New Repayment - Monthly | $0.00 | $0.00 | $9,647.00 | $13,311.00 | $13,390.00 | $15,419.00 | $15,928.00 | $16,171.00 | $16,466.00 | $16,790.00 |
By increasing your repayments to the amount projected it is projected that:
Projected Benefit of Strategy
Projected Net Investment Position